Data · Ukraine in charts
CO₂ emissions per person in Ukraine
Carbon dioxide emissions per person in Ukraine compared with Poland, the EU and the world.
CO₂ emissions per person in Ukraine, 1950 to 2025
tonnes per person
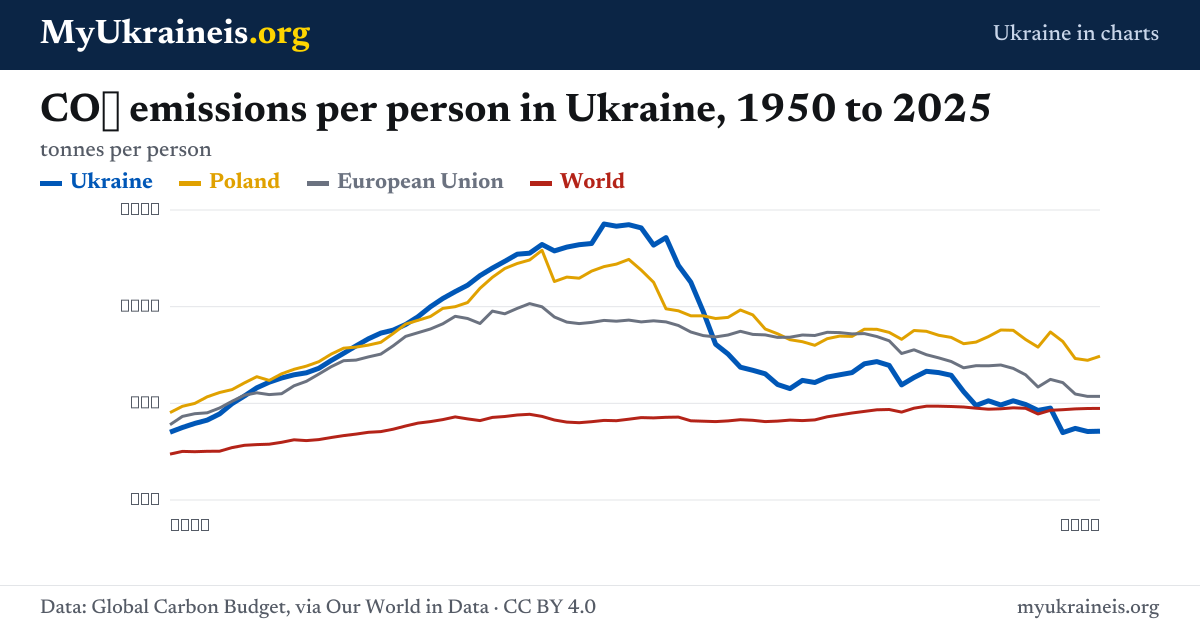
In 2025, Ukraine’s CO₂ emissions per person was 3.6 tonnes per person. For comparison: Poland 7.4, the EU 5.4, the world 4.7. Since 1991 it has fallen by 71%, from 12.1.
The figures
| Year | Ukraine | Poland | European Union | World |
|---|---|---|---|---|
| 1970 | 9.5 | 9.3 | 8.7 | 4.0 |
| 1975 | 11.6 | 11.0 | 9.1 | 4.1 |
| 1980 | 13.2 | 12.9 | 10.0 | 4.3 |
| 1985 | 14.3 | 12.1 | 9.3 | 4.1 |
| 1990 | 13.6 | 9.9 | 9.2 | 4.3 |
| 1995 | 7.6 | 9.4 | 8.5 | 4.1 |
| 2000 | 5.8 | 8.3 | 8.4 | 4.1 |
| 2005 | 6.6 | 8.5 | 8.6 | 4.5 |
| 2010 | 6.3 | 8.8 | 7.8 | 4.7 |
| 2015 | 4.9 | 8.2 | 6.9 | 4.8 |
| 2020 | 4.6 | 7.9 | 5.8 | 4.4 |
| 2025 | 3.6 | 7.4 | 5.4 | 4.7 |
More charts
- GDP per capita →
- GDP per capita →
- Life expectancy at birth →
- Population →
- Fertility rate →
- Military spending →
Source: Global Carbon Budget, via Our World in Data.
More data on Ukraine
Ukraine in chartsGDP per capita: Ukraine compared with Poland and the EUIn 2025, Ukraine’s GDP per capita was $16,155.Ukraine in chartsGDP per capita in Ukraine over two centuriesIn 2022, Ukraine’s GDP per capita was $7,749.Ukraine in chartsLife expectancy in UkraineIn 2023, Ukraine’s life expectancy at birth was 73.4 years.Ukraine in chartsPopulation of UkraineIn 2023, Ukraine’s population was 37.7 million.Cost of livingPetrol price in Ukraine todayA-95, A-92, diesel and autogas by chainCost of livingBorscht Index: a pot of borscht in UkraineFive-litre pot at official average prices
Questions and answers
What is Ukraine’s CO₂ emissions per person?
In 2025, Ukraine’s CO₂ emissions per person was 3.6 tonnes per person. For comparison: Poland 7.4, the EU 5.4, the world 4.7. Since 1991 it has fallen by 71%, from 12.1.
Can I use this chart?
Yes. The chart and data are free to reuse under CC BY 4.0: credit “MyUkraineis.org, data from Our World in Data” and the original source. Download the PNG or the CSV under the chart.