GDP per capita: Ukraine compared with Poland and the EU
Ukraine’s GDP per person, adjusted for prices, compared with Poland, the EU and Russia since 1990.
GDP per capita: Ukraine compared with Poland and the EU, 1990 to 2025
international-$ at 2021 prices (PPP)
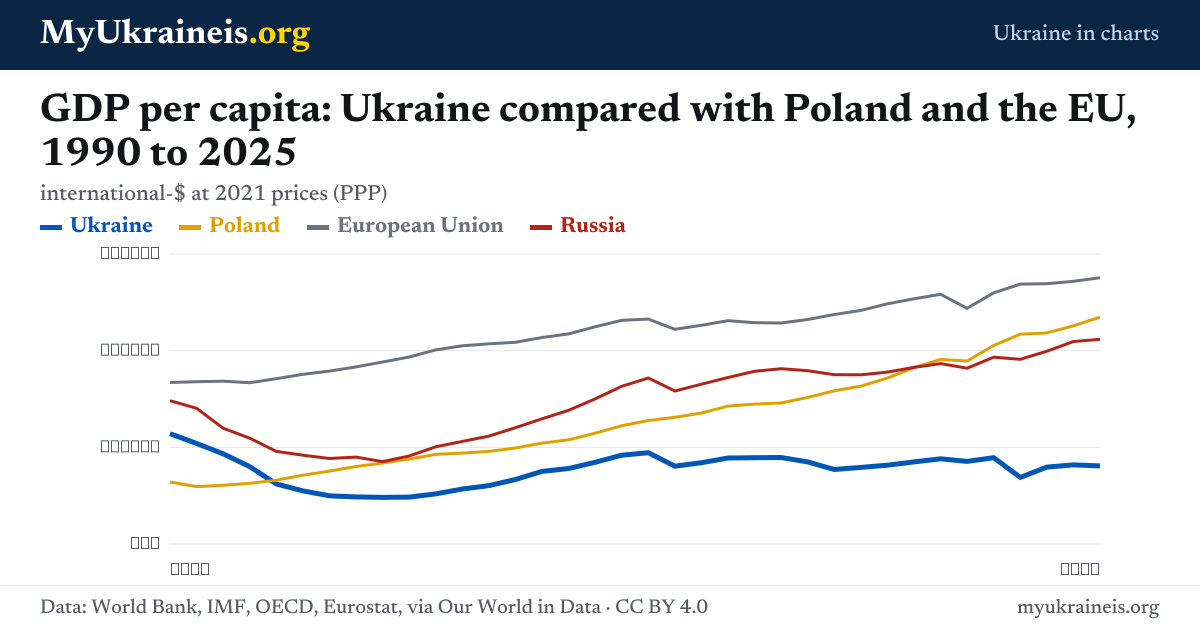
In 2025, Ukraine’s GDP per capita was $16,155. That is 34% of Poland’s, 29% of the EU average, 38% of Russia’s. Since 1991 it has fallen by 22%, from $20,784.
The figures
| Year | Ukraine | Poland | European Union | Russia |
|---|---|---|---|---|
| 1990 | $22,816 | $12,821 | $33,423 | $29,644 |
| 1995 | $10,983 | $14,228 | $35,114 | $18,364 |
| 2000 | $10,364 | $18,566 | $40,161 | $20,105 |
| 2005 | $15,611 | $21,569 | $43,477 | $27,657 |
| 2010 | $16,812 | $27,112 | $45,251 | $33,064 |
| 2015 | $15,404 | $31,700 | $47,491 | $35,037 |
| 2020 | $17,093 | $37,853 | $48,770 | $36,376 |
| 2025 | $16,155 | $46,925 | $55,087 | $42,358 |
More charts
- GDP per capita →
- Life expectancy at birth →
- Population →
- Fertility rate →
- Military spending →
- CO₂ emissions per person →
Source: World Bank, IMF, OECD, Eurostat, via Our World in Data.
More data on Ukraine
Questions and answers
What is Ukraine’s GDP per capita?
In 2025, Ukraine’s GDP per capita was $16,155. That is 34% of Poland’s, 29% of the EU average, 38% of Russia’s. Since 1991 it has fallen by 22%, from $20,784.
Can I use this chart?
Yes. The chart and data are free to reuse under CC BY 4.0: credit “MyUkraineis.org, data from Our World in Data” and the original source. Download the PNG or the CSV under the chart.