Data · Ukraine in charts
GDP per capita in Ukraine over two centuries
Long-run income per person in Ukraine, Poland and Germany since 1820.
GDP per capita in Ukraine over two centuries, 1820 to 2022
international-$ at 2011 prices
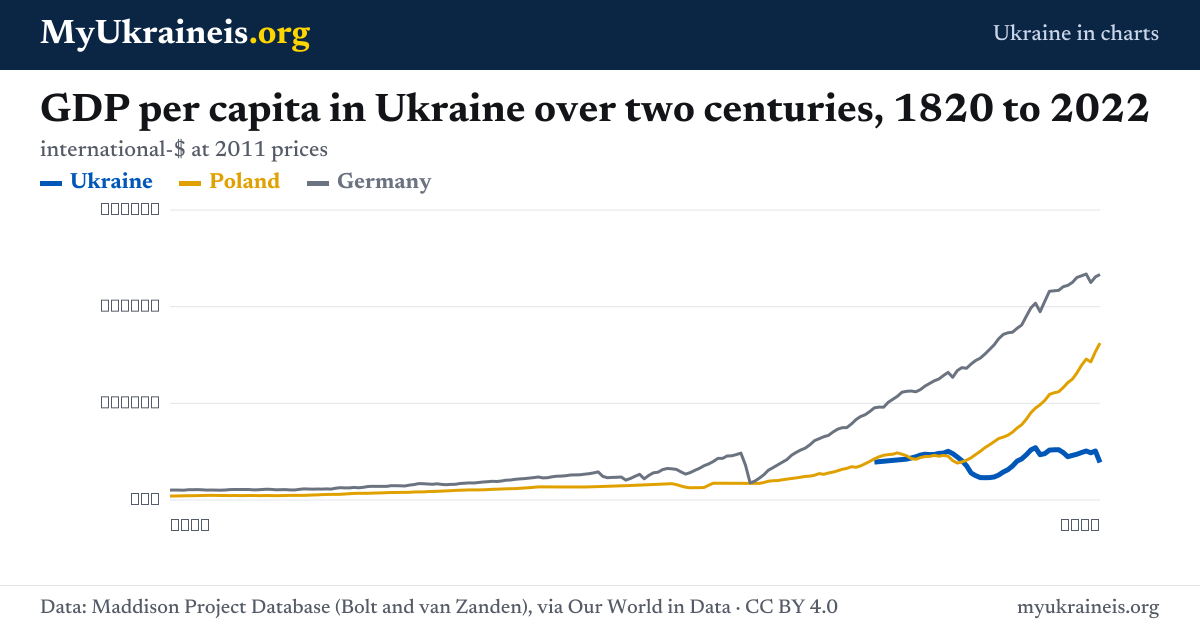
In 2022, Ukraine’s GDP per capita was $7,749. That is 24% of Poland’s, 17% of Germany’s. Since 1991 it has fallen by 13%, from $8,899.
The figures
| Year | Ukraine | Poland | Germany |
|---|---|---|---|
| 1980 | $8,467 | $9,149 | $22,497 |
| 1985 | $9,387 | $9,022 | $24,133 |
| 1990 | $9,607 | $8,150 | $25,391 |
| 1995 | $5,024 | $9,408 | $28,869 |
| 2000 | $5,166 | $12,732 | $33,367 |
| 2005 | $8,497 | $15,581 | $36,206 |
| 2010 | $9,601 | $20,609 | $41,110 |
| 2015 | $8,959 | $24,285 | $44,405 |
| 2020 | $9,770 | $28,577 | $44,996 |
| 2022 | $7,749 | $32,468 | $46,648 |
More charts
- GDP per capita →
- Life expectancy at birth →
- Population →
- Fertility rate →
- Military spending →
- CO₂ emissions per person →
Source: Maddison Project Database (Bolt and van Zanden), via Our World in Data.
More data on Ukraine
Ukraine in chartsGDP per capita: Ukraine compared with Poland and the EUIn 2025, Ukraine’s GDP per capita was $16,155.Ukraine in chartsLife expectancy in UkraineIn 2023, Ukraine’s life expectancy at birth was 73.4 years.Ukraine in chartsPopulation of UkraineIn 2023, Ukraine’s population was 37.7 million.Ukraine in chartsFertility rate in Ukraine: births per womanIn 2023, Ukraine’s fertility rate was 0.98 live births per woman.Cost of livingPetrol price in Ukraine todayA-95, A-92, diesel and autogas by chainCost of livingBorscht Index: a pot of borscht in UkraineFive-litre pot at official average prices
Questions and answers
What is Ukraine’s GDP per capita?
In 2022, Ukraine’s GDP per capita was $7,749. That is 24% of Poland’s, 17% of Germany’s. Since 1991 it has fallen by 13%, from $8,899.
Can I use this chart?
Yes. The chart and data are free to reuse under CC BY 4.0: credit “MyUkraineis.org, data from Our World in Data” and the original source. Download the PNG or the CSV under the chart.